Why is machine learning in finance so hard?
11 Feb 2018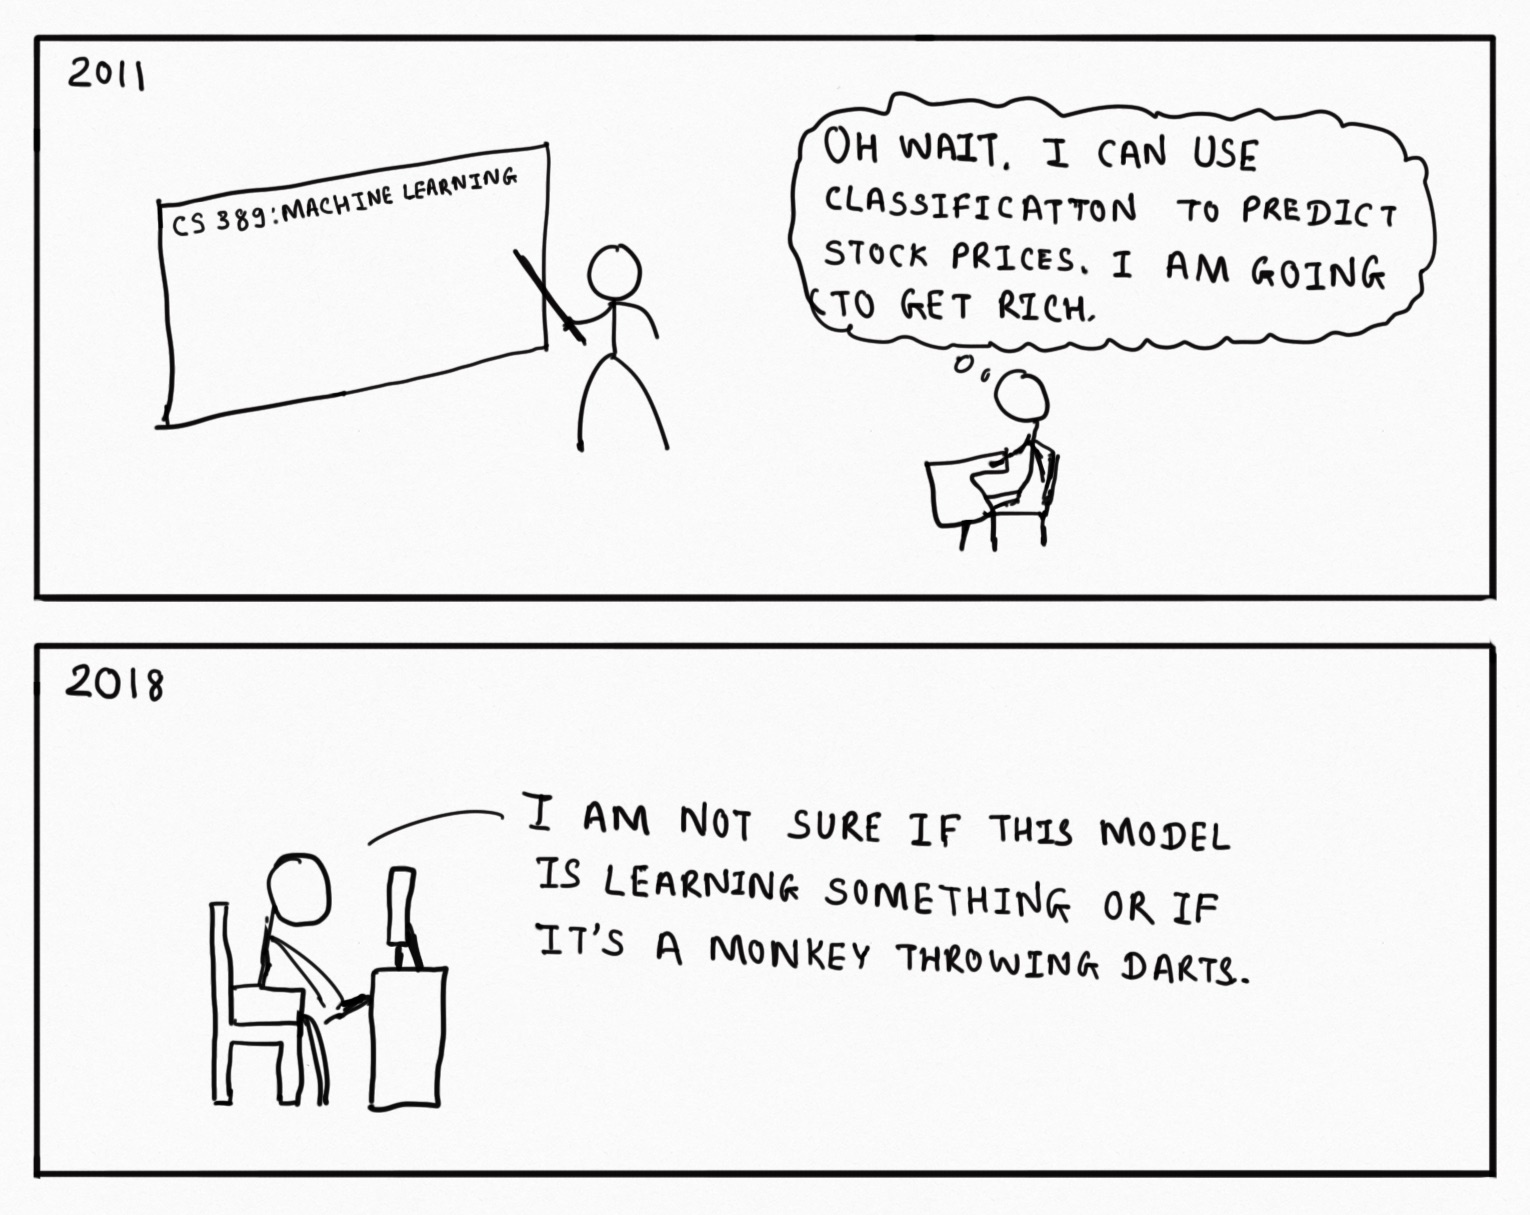
- Data Distribution
- Small Sample Sizes
- Unquantifiable Data
- It’s Quite Complex
- Partially Observable Markov Decision Process
- Similarities to Recommender Systems
- Closing Thoughts
Financial markets have been one of the earliest adopters of machine learning (ML). People have been using ML to spot patterns in the markets since the 1980s. Even though ML has had enormous successes in predicting the market outcomes in the past, the recent advances in deep learning haven’t helped financial market predictions much. While deep learning and other ML techniques have finally made it possible for Alexa, Google Assistant, and Google Photos to work, there hasn’t been much progress when it comes to stock markets.
I am not a researcher. But, I apply machine learning to real-world financial prediction problems. Even though there are a number of papers claiming the successful application of deep learning models, I view those results with skepticism. Some of these models do actually have better accuracies. However, the magnitude of difference is often not high enough.
Improvements in NLP have helped increase the effectiveness of quantitative strategies that rely on document analysis. This is one rare benefit of deep learning models in financial markets. Even in this set of problems, the predictions remain weak.
All this leads to the fact that financial markets are inherently unpredictable. There are multiple reasons why it’s so hard to predict here. I want to highlight some major reasons that make it hard.
Data Distribution
The issue of data distribution is crucial - almost all research papers doing financial predictions miss this point.
We can contrast the financial datasets with the image classification datasets to understand this well. Let’s consider the CIFAR-10 dataset. It consists of 10 classes. There are exactly 5000 images in the training set for each class and exactly 1000 images in the test set for each class.
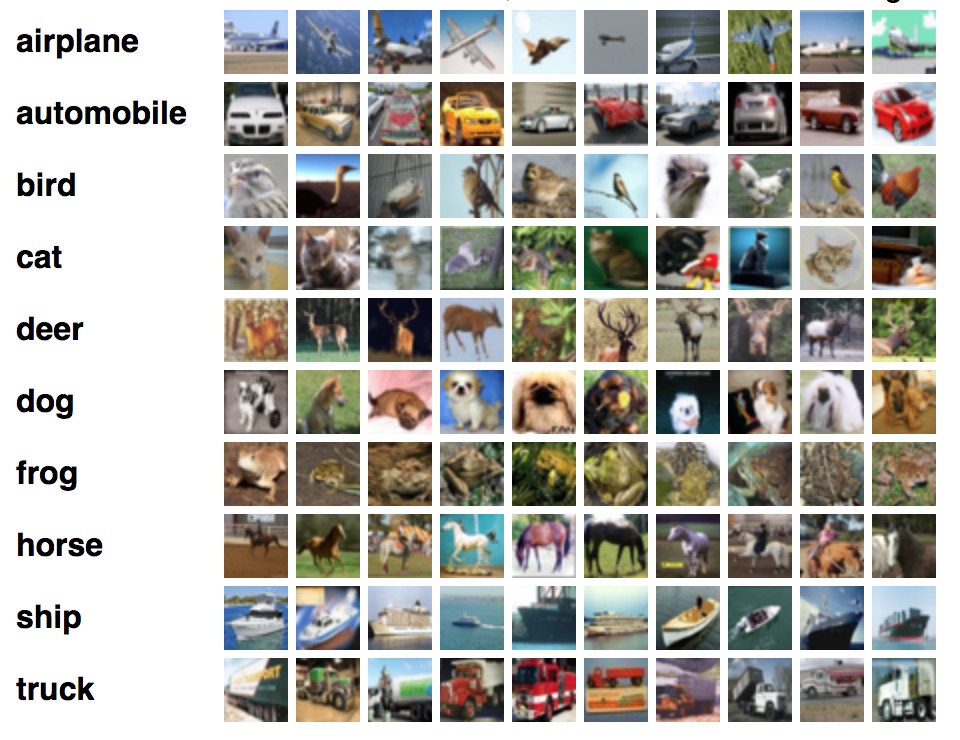
We expect the distribution of pixel weights in the training set for the dog class to be similar to the distribution in the test set for the dog class. In other words, dog images will contain dogs both in the training set as well as the test set. It is quite silly to state the obvious: dogs images has to contain dogs.
This obvious property simply doesn’t hold for most financial datasets. What you may see in future may be completely different from the data you have seen so far. In fact, this is a common issue when it comes to applying machine learning to real-world problems. In addition to making sure the test and train sets have similar distributions, you also have to make sure the trained model is used in production only when the future data adheres to the train/validation distribution.
While most researchers have been mindful not to incorporate look-ahead bias into their research, almost everyone fails to acknowledge the issue of evolving data distributions.
Walk forward optimization is one option available to deal with this problem. This is relatively known among practitioners, but researchers often fail to mention this. However, even the *walk forward optimization is not a panacea for the underlying problem - it makes assumptions for how the future data distribution will look like. This is why walk forward approach doesn’t really get you to high accuracies - it just makes practical
Small Sample Sizes
There is often a requirement to do prediction from small datasets. One example is the labor statistics like the unemployment rate and nonfarm payrolls. They have one datapoint for each month. There is simply not enough history. An extreme case would be the financial crisis - there is just one datapoint for us to learn from.
This makes it really hard to apply automated learning approaches. One approach many people end up taking is to combine less frequent statistics with relatively frequent data. For example, you can combine nonfarm payroll with the daily stock returns and feed this combined dataset to the model. However, there is often a lot of oversight needed to remove the doubts about the quality of the model.
Unquantifiable Data
One could argue that the timeline of our financial history is same as the human history itself. Unfortunately, it’s hard to convert that to quantifiable data - to a form that algorithms can understand. For example, even if we have a complete understanding of what happened during the great depression of the 1930s, it’s hard to convert it to a form that makes it usable for an automated learning process.
It’s Quite Complex
The complete financial prediction problem is really complicated. Various things drive prices at different scales:
- High frequency trading and algorithmic trading are the main drivers of price at short intervals (< 1 day).
- Opening and closing prices have their own patterns - both in stocks and futures - the two asset classes I have worked with.
- News and rumors are the driving forces when it comes to multi-day horizons. Specific company news can happen at any time without any prior notice. However, the timeline for some events is known beforehand. Company result schedule, as well as the economic data calendar, are known beforehand.
- Value investing and economic cycles matter the most when it comes to price changes at a multi-year range.
Mixture of experts can be used to combine the models from different scales - but, this is a hard problem as well. (Please note that mixture of experts is a very common technique to combine the models from the same scale - almost all quant asset management firms employ this technique.)
Partially Observable Markov Decision Process
I like to think of the price time series as a Partially Observable Markov Decision Process (POMDP). No one really has a complete picture at any point in time. You don’t know what will happen tomorrow - you still have to make a decision about your trade. The information you have is quite minimal. At the same time, the distribution of data is constantly changing.
I have tried to apply the reinforcement learning approaches to financial problems. Even though I simplified the problem (i.e. the state and the action space) extremely, it just couldn’t learn anything useful. I spent weeks debugging why it doesn’t work - turned out the RL algorithms need enough predictability to being with.
Similarities to Recommender Systems
ML is applicable in very diverse domains. Out of all of them, I find recommendation systems to be the closest cousin of financial prediction problems. Comparision with recsys brings out the difficult aspects of underlying problems.
- Both have relatively lower accuracy. Let’s consider the Netflix example. Netflix shows at least 20 movie options on the main page. So for each recommendation, the average likelihood of a user choosing to watch a movie is < 1/20. There is a “less than” sign because the user might just drop off without watching anything. Similarly, most of the binary classification problems in financial time series have accuracies hovering around 50%.
- Both have a lot of noise in the data. Noise to signal ratio is very high in both cases. Noise is high in the financial time series because so many different factors affect the prices. Recsys datasets contain noise (pdf) because users’ browsing is often noisy - a user can visit a specific Amazon product page for absolutely no intention of buying anything from that category - this ends up adding noise.
- Both have seasonalities in their datasets. Purchase patterns (i.e. product sale distribution) on Amazon during the holidays would be different from the rest of the year. Same applies other recsys problems: e.g. movie interest and youtube video choice would also depend on the time of the year. Financial data also has seasonality baked into it, the most common seasonality being the economic cycles.
- Both have to deal with the unseen ‘events/items’. Amazon keeps adding new items to their catalog, Netflix keeps adding more titles to their list, new videos get uploaded to Youtube every minute. Recommender systems have to work around this problem - how to recommend items that were not a part of the training set. As mentioned in the Data Distribution section, financial data can contain totally different events from what was available during model training.
- Both have to combine different types of data for model training. Youtube has some both discrete features like “the list of last N videos watched” and it also has continuous features like “the watch time for the last video”. Similarly, a financial dataset can consist of higher frequency prices as well as lower frequency economic numbers.
Closing Thoughts
If there is one thing you take away from this post, let it be this: Financial time-series is a partial information game (POMDP) that’s really hard even for humans - we shouldn’t expect machines and algorithms to suddenly surpass human ability there.
What these algorithms are good at is the ability to unemotionally spot a hardcoded pattern and act on it - this unemotionality is a double-edged sword though - sometimes it helps and other times it doesn’t. The simple pattern recognition cases where it has helped the most have all been exhausted. The next stage of recognizing patterns in the financial time series through unsupervised learning remains an elusive dream.