Improving Factor-Based Quantitative Investing by Forecasting Company Fundamentals (Paper Summary)
14 Dec 2017arXiv link: https://arxiv.org/abs/1711.04837
Stock price movement happens at various levels. In the very short term (intraday), price movement is often driven by liquidity in the market. At the scale of few days, overall market movements as well as rumors, prroduct launches and sales reports play important roles. In the long run, the price movement depends on the company’s fundamental data like sales numbers and book value. Various quant funds work on all of these different levels, all the way from HFT market making (intraday movement) to doing factor strategies.
A typical flow for developing a factor strategy involves selecting one or more factors and ranking the stocks based on selected factors. The strategy bets on some stocks being undervalued according to the selected factors.
Data and Preprocessing
Data consists of 11,815 stocks listed on NYSE, NASDAQ and AMEX from 1970 to 2017. Non-US based companies as well as those with market cap below $100M are removed. Granularity of data is adjusted to have one datapoint per month for each company. Each datapoint consists of 20 features: 16 engineered features and 4 momentum features.
Income statement features - trailing twelve months (TTM):
- Revenue
- Cost of goods sold
- Selling, general and admin expense
- Earnings before interest and taxes (EBIT)
- Net income
Balance sheet features - most recent quarter (MRQ):
- Cash and cash equivalents
- Receivables
- Inventories
- Other Assets
- Property plant and equipment
- Other Assets
- Debt in current liabilities
- Accounts payable
- Taxes payable
- Other current liabilities
- Total liabilities
4 momentum features are price movement of the stock over the previous 1, 3, 6, and 9 months. They use percentile among all stocks rather than absolute numbers.
Fundamental features are normalized by the market capitalization of the company. The features are then scaled to zero mean and unit standard deviation.
Models
In-sample and out-of-sample data are chosen at 2 levels:
- 1970-2017 period is divided into in-sample period of 1970-1999 and out-of-sample period of 2000-2017.
- Within the in-sample period, the stock universe is divided to select 30% stocks for validation.
In-sample validation set is used to indentify the hyperparameters and the early stopping criteria. The same model is used to predict all 16 fundamental features.
At each time step \(t\), features from 5 months spaced 1 year apart (\(t-48, t-36, t-24, t-12, t\)) are used to predict the fundamental data at time t + 12. The authors used multilayer perceptron (MLP) and recurrent neural network (RNN) models for this prediction setup.
Results
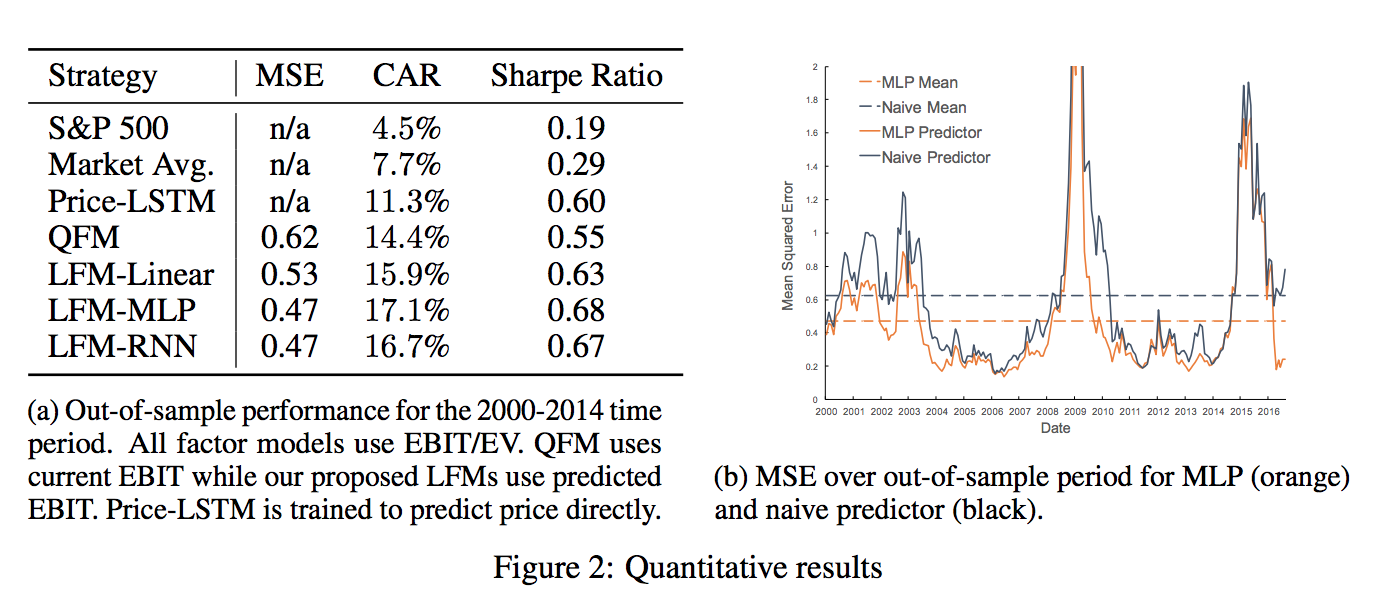
From the above result table, it’s clear that using predicted future fundamental data is more effective in the strategy return space. And among the prediction models, MLP is doing a better job than a linear regression model.
The strategy simulation was done by ranking all stocks according to the factor EBIT/EV (Earnings before interest and taxes). Top 50 stocks were selected. They allocated equally in these top 50 stocks and kept the positions for the next 1 year. At the end of the year, they would rebalance according to the new predictions and rankings.